

Cumulatives can be entered into the SmartFarm app using a very simple roadmap. Degree days, cold hours and precipitation sum, are calculated from FieldMate data. The results are very reliable because they are measured where the plants are developing, in the field. All measurement points from the FieldMate can be used for degree days and cold hours calculations. Setting the threshold value is also among the possibilities.
Cumulative overhead calculations
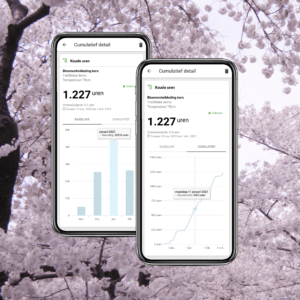
Because all measurement points of the FieldMate can be used, the results of the cumulatives can be used for multiple purposes. Consider determining whether sufficient cold hours have been achieved for fruit trees for regular bud development followed by a good harvest with high fruit quality. The amount of cold hours required depends on the crop and cultivar. For calculation of cold hours in fruit trees, the 75cm high temperature sensor can be used.
Accumulating temperatures at 25cm altitude can help predict insect development, among other things. By calculating the number of degree days in the crop, one can start scouting for insects better prepared. A good example of insect development based on degree days are thrips. Thrips are known to hatch eggs upon reaching a temperature range of 95.4°C degree days, after which the larvae become active. If scouting is started on time and crop protection is started on time, much crop damage can be prevented.
Calculating cumulatives underground
In addition to above-ground temperature sensors, below-ground temperature sensors can also be used. Examples include determining root development and determining the first nitrogen application rate for grassland. Here, the amount of degree days is a measure of soil warming and the proper stage of grass. Using the measurement data from the temperature sensor at -5cm depth, one is constantly informed about the status of the soil and grass.
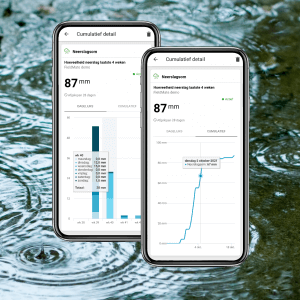
Precipitation
The precipitation sum is a simple tool to see how much precipitation has fallen over the past few days, weeks or months, or between 2 different dates. Because of the simple overview, one can make comparisons in amounts of precipitation between seasons, crops and years. Among other things, this can help optimize irrigation strategy.
Stay informed
Keep up to date with the latest developments in SmartFarm